I can’t believe it, I was going through notes on articles to write for 2017 and I totally missed the 2017 Appraisal Fee Survey from WorkingRE.com.
So I thought I would post information about it today. You can find links to each state and get individual city information from there. This is a very detailed report. Thanks again Isaac and David!

2017 Fee Survey: Analyzing the Data
By Isaac Peck and David Brauner, Working RE Magaizne
For the last few years the appraisal industry has been abuzz with talk of rising appraisal fees and longer turn times. AMCs complain of a shortage of appraisers and “price gouging” in certain markets (Colorado and Oregon, for instance); appraisers report modest success at raising their fees after years of frustration (See Fees Rising).
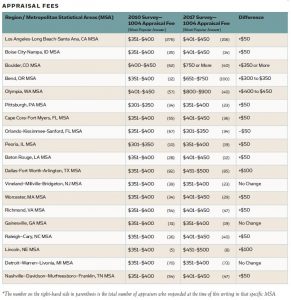
With over 7,000 appraisers responding so far, the results of the 2017 Working RE/OREP Appraiser Fee Survey is a current source for fee and turn time data by market and nationwide. (To view the survey results for your market, click here. The number in the right-hand side in parentheses is the total number of appraisers in that specific MSA who responded at the time of this writing.) The survey remains open if you have not participated yet. The data is provided free to appraisers and all industry stakeholders.
The new fee data offers an interesting comparison with the results of the first Customary and Reasonable Fee Survey, which was conducted in 2010 in the wake of the Home Valuation Code of Conduct (HVCC) and the ascendance of AMCs. The first survey results measure non-AMC appraisal fees only—where appraisers and clients negotiated fees directly without a middleman. The new survey makes no distinction. So today, more than seven years later, the comparison of fees and turn times between then and now— before AMCs and after—offers Working RE readers a unique perspective.
Surveys Said
Both surveys include 365 Metropolitan Statistical Areas (MSA), as defined by the U. S. Census Bureau, with rural areas included by state. Each survey includes eight different appraisal products, including reviews and FHA appraisals. Both surveys address turn times. While the earlier survey includes only non-AMC appraisal reports, the current survey draws no distinction between AMC and non-AMC appraisals, as noted.
Increasing Fees and Turn Times
The new survey results show higher fees in many markets compared to 2010 but for most, only marginally. Turn times have grown in many markets as well. As you compare the fees in your area, note that the Cost of Living Adjustment (COLA), which is tied to inflation and on which social security benefits are paid, has increased 8.8 percent in the same time period. The Consumer Price Index has gone up 11.3 percent.
Comparing Then and Now
The tables posted here compare data from the two surveys in a few select markets. Complete data from all 350 MSAs nationwide are available here. As you will note, fees in certain areas have stagnated, a few have actually declined, but overall, a modest increase can be observed in many markets. Some markets have improved dramatically.
(Click here to see the Tables comparing Fees and Turn Times.)
(Click here to find information by State / City)
The fee/range reported for each MSA reflects the result with the greatest percentage of responses.
Modest Good News
That appraisal fees appear to be rising modestly in many markets is good news for appraisers. But as you can see, appraisers in certain locations are faring much better than in others. It should also be noted there are probably 20 percent fewer active and licensed appraisers working today than there were then.
Both surveys include fees and turntime data on a number of appraisal products, including the 1004 REO, 1004 FHA, 2055, 1025, and more.
After seeing fees decline substantially with the imposition of AMCs, the fact that many appraisers have regained some or all of what was lost (and then some) offers hope of better times to come.
The data should be a strong nudge to those appraisers in competitive markets who have not yet raised their fees and/or enhanced their product. If you are not confident enough in your skills to raise your rates to market, there are many resources available to you, including quality online CE offered through OREPEducation.org. Economical bundle pricing is available on a variety of coursework. OREP insureds save.
Thanks to the many thousands of appraisers who helped make the survey possible. If you are an appraiser and have not yet taken the survey, please weigh in today! And when it’s time for E&O, shop OREP for great appraiser insurance rates, broad coverage and fast, efficient service. Thanks for reading!
About the Authors
David Brauner is Publisher of Working RE magazine and Senior Broker at OREP, a leading provider of E&O Insurance for appraisers, inspectors and other real estate professionals in 50 states (OREP.org). He has provided E&O insurance to appraisers for over 20 years. He can be contacted at dbrauner@orep.org or (888) 347-5273. Calif. Insurance Lic. #0C89873. Visit OREP.org today for comprehensive coverage at competitive rates.
Isaac Peck is the Editor of Working RE magazine and the Director of Marketing at OREP, a leading provider of E&O insurance for home inspectors, appraisers, and other real estate professionals in all 50 states and D.C. He received his master’s degree in accounting at San Diego State University. He can be contacted at isaac@orep.org or (888) 347-5273.


